PARADIM has deployed the first deep learning model of crystal synthesis to assist facility users as they optimize synthesis conditions and accelerate the realization of their materials design plans.
|
|
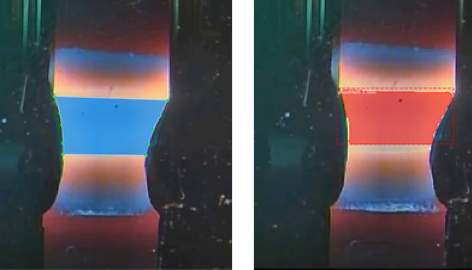
Figure 1: Machine learning for Floating Zone Crystal growth. (Left) Melt zone labeled for training (Right) Masked by ML. Image segmentation from the trained model rapidly identifies the melt zone (see right). |
Optical floating zone furnaces are the backbone of single-crystal synthesis. PARADIM’s deep learning model relates melt-zone geometry to the complex parameter space of the furnaces. Deployment of the model leverages PARADIM’s prototype streaming data pipeline allowing real time feedback to users running on the laser diode furnace.
The PARADIM model combines image segmentation to capture melt zone geometry with extraction of furnace parameters from streaming video during synthesis. Parameters are streamed to a dedicated SQL database with extracted image frames stored as files in the PARADIM Data Collective. Stream processing triggers the learning model which inserts segmented images into the database.
PARADIM Users receive feedback through JupyterLab dashboards for simple interactivity and flexible design.
D. Elbert, et al. “Advancement of Data Intensive Approaches in Materials Discovery and Design”, TMS 2020 Annual Meeting, February 23-27, 2020 | San Diego, California.
Technical Details:
The machine learning model involves tracking state variables across the long latency of synthesis parameters. That is, one may change a furnace parameter but not see the connected change to melt geometry for 10 minutes or more, so we have built a model that tracks the state of the system through time and learns across that large span. We are using a variety of methods to extract relationships from that model.
|
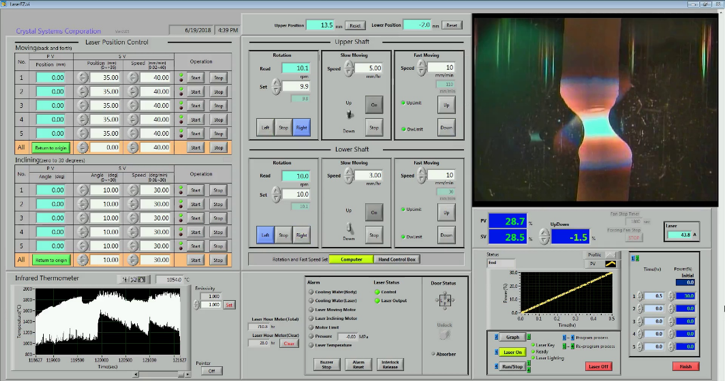
| Figure 2: Import growth parameters including laser power and inclination, upper rod rotation speed, direction, and feed rate, and lower rod rotation must be balanced to prevent melt-zone instabilities. |
What is pictured here is the piece of the model that does image segmentation and classification. That specifically means the model can find the part of the image that corresponds to melt and classify the geometry of that melt into one of the groupings that is relevant to success such as variances in rotational speeds of the top of bottom. These classes are still rudimentary and derived from expert knowledge but will be improved once our full state model is more effective.
The machine learning provides a particularly exciting opportunity to apply our streaming data platform. We now can capture live video of a synthesis, stream it into the pipeline. The deployed deep learning model is subscribed to that feed and then automatically uses the model to provide results to our database. We’ve provided a simple dashboard in a web browser so the user, or facilities science team can visualize the synthesis and model output all in real time, during the synthesis. We capture video at one-frame-per-second and return the results to the dashboard before the next frame arrives.
This collaborative work was conducted at the NSF Materials Innovation Platform PARADIM and brought together researchers from Johns Hopkins University and the Army Research Laboratory.
Full reference: D. Elbert, B. Schuster, N. Carey, C. Krill, A. Rachidi, W. Phelan, and T. McQueen, “Advancement of Data Intensive Approaches in Materials Discovery and Design”, invited paper at TMS 2020, the 149th Annual Meeting & Exhibition of “The Minerals, Metals & Materials Society”, San Diego, California, USA (2020).
Return to: In-house Research Highlights